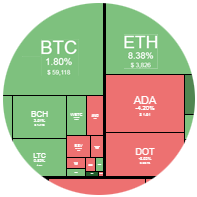
Financial and economic market analysis... along with articles and archives of key fundamental news, macroeconomic insights, and smart money positioning, as well as central bank decisions and national regulations impacting market trends, coupled with archived analyses, will assist you in gaining comprehensive market perspectives, making informed decisions on entry and exit points, and generating necessary forecasts...
🚦 تحلیل های آنچین امروز ارزهای دیجیتال 🗨


Heat map of the Australian capital stock market
The Australian stock market in Melbourne, called the Australian Securities Exchange (ASX), is one of the top five global markets and...


Toobit Named Best Crypto Day Trading Exchange by CoinGape
Toobit wins Best Crypto Exchange for Day Trading at 2026 CoinGape Web3 Innovation Awards. Advanced features include deep liquidity, AI tools, zero-fee trading, and tokenized stock futures for professional traders.

Types of chart patterns in technical analysis
A technical chart pattern, or chart pattern, is a graphical representation of the price and trading volume of a financial asset that uses specific lines, dots, shapes, and patterns to analyze price behavior


صندوق درآمد ثابت فارابی

سود روزشمار 39.5 درصد را در نکسو کارت (متعلق به بانک پارسارگاد) تجربه کنید 📞 تماس: 1561

🏹 هم کارت بانکی و هم سرمایه گذاری و کسب درآمد