


By joining our Telegram channel, you can stay informed about the daily news, market status, analyses and the day's signals

Why is this news archive important?
Because behavioral studies across different periods show that events repeat and cycle over time, producing almost identical reactions, and ...
Every news item is a guiding light for anticipating the scenarios ahead ...
How did the market's psychological reaction and the price trend respond to each news item or rumor?
Every news item is a market-psychology analysis and an initial forecast to help you prepare for future events ...
This page contains 16968 archived news items
Bitcoin’s Reaction to the US Midterm Elections; Should We Expect a Crash?
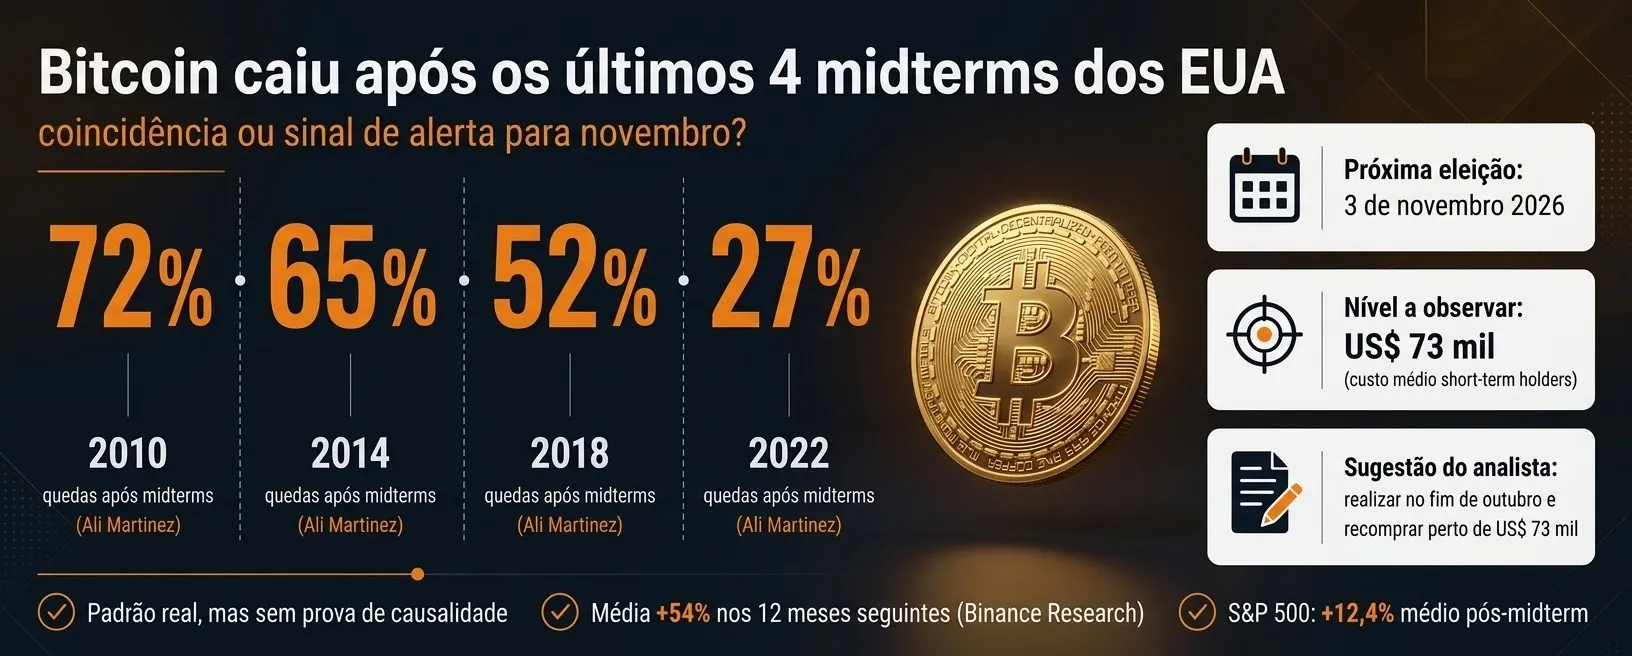
According to the analyst, Bitcoin has recorded heavy corrections of 27 to 72 percent after each of the past four midterm elections; however, if selling pressure intensifies, the key level of $73,000 will be the most important defensive bulwark for buyers to contain the decline.
📈 The copper market takes center stage for traders...
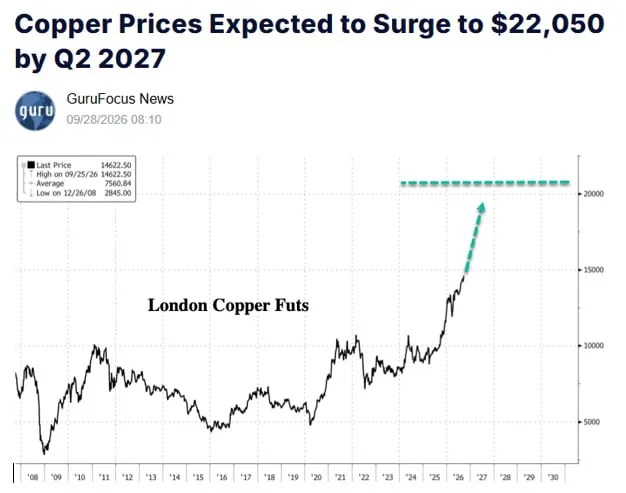
📍 What are the reasons behind this forecast?
▪️ Accumulation of copper stockpiles: The US and China are increasing their copper reserves and could control approximately 71% of the global copper supply by the end of 2026.
▪️ Reduced global market supply: The movement of copper into US warehouses, combined with rising Chinese stockpiles, could limit access to copper for other consumers.
📈 Technical Analysis of Compound (COMP); Attractive Setup on the verge of a Double Breakout
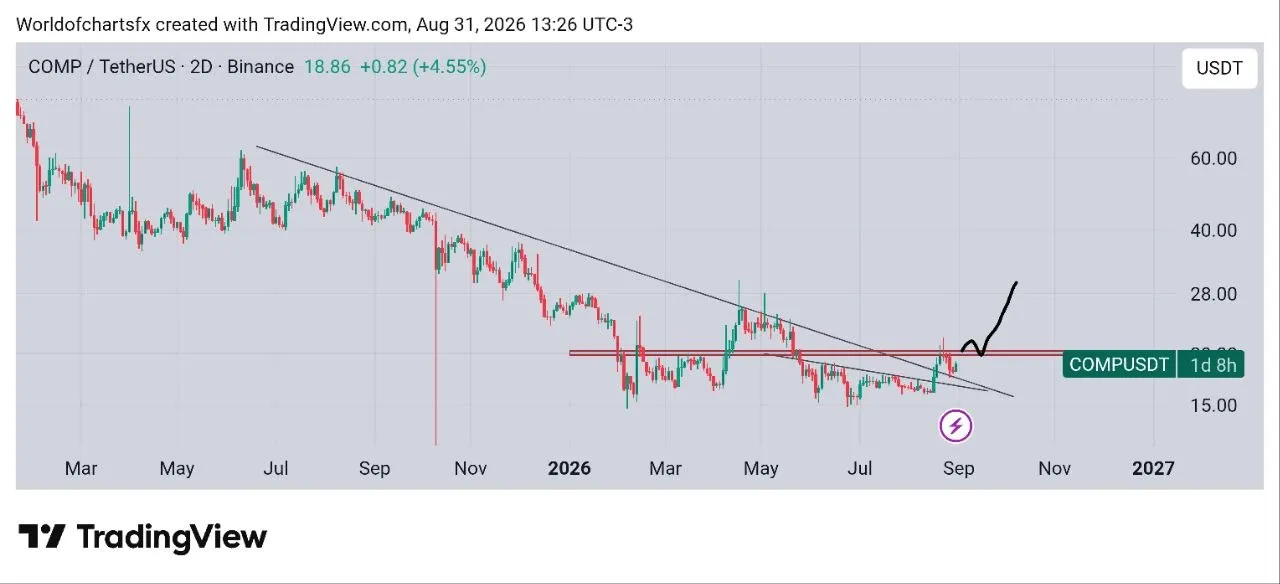
The digital currency Compound (COMP) has formed a very attractive technical stop on the 2-day timeframe. The current price is around $18.9 with a growth of +3% and is simultaneously testing the long-term downtrend line and the key horizontal resistance area.
📊 Key Areas:
⏺ Current Breakout Area: $18.00-$20.00 (Red Box)
⏺ First Target (Recovery): $28.00
⏺ Second Target: $40.00
⏺ Key Support (Potential Pullback): $16.0-$17.00
⏺ Stronger Support: $15.00
⬆️ Bullish Scenario:
If COMP rises strongly above $20.00, the path is paved for a solid recovery to $28.0 and then $40.0. A simultaneous break of the downtrend line (from July 2025) and the horizontal zone is a very strong technical guide.
Bearish Scenario:
If the following fails to hold the current level and return to $16.0, the current breakout could be considered a “Fakeout” and the price could re-open to the $15.00 range.
💡 Additional Analysis:
● Double Breakout: The price is simultaneously breaking two key resistances - the long-term downtrend line and the horizontal range zone. These types of breakouts are usually more reliable.
● Long-term Accumulation Pattern:
The price has been accumulating in the $15-$20 range from January to September 2026. This long-term compression has provided the energy needed for an explosive move.
● Strong Recovery Potential:
I believe that a consolidation above the horizontal zone could trigger a “strong recovery.” Given the previous highs ($60), there is significant upside potential.
● Pullback:
After major breakouts, the price usually pulls back to the breakout zone ($18-$20). This point is
● Fundamental Composition:
As one of the pioneer decentralized lending protocols (lending protocols) in the DeFi ecosystem, Compound has a strong foundation. The growth of the DeFi ecosystem can directly affect the price of COMP.
● Risk Management:
Please note that you should place your stop loss below the 16.0 support zone when entering a long position to protect yourself from potential volatility.
🎯 Recommended Strategy:
For New Entry:
- Enter on a pullback to $8.00-20.00 with a stop loss below $16.00
- First Target: $28.00
- Second Target: $40.00
For Holders:
- Maintain position with a Trailing Stop
- Identify the steps to the marked door
🏦 JPMorgan on the verge of launching its own stablecoin; Wall Street's strategic stance shifts

Jamie Dimon, CEO of JPMorgan, who has previously been known as a staunch critic of Bitcoin (BTC), has announced that the bank plans to get involved in the stablecoin space to gain a deeper understanding of the technology. The move comes at a time when big traditional competitors such as Citigroup and Bank of America (BofA) are entering the arena.
💡 Fundamental Analysis and Market Impact:
● Wall Street Shift: Jamie Dimon’s shift in tone from warning about crypto risks to active adoption of stablecoin technology signals the industry’s inevitable maturation and growing competitive pressure to keep up with the digital finance revolution.
● Challenge to Current Monopoly: The entry of trillion-dollar banking giants into the stablecoin market could challenge the current monopolies of Tether (USDT) and USD Coin (USDC). These banks are likely to launch stablecoins with full regulatory transparency and direct backing of the US dollar (USD).
● BASE Ecosystem Validation: The initial success of the JPMD token on the BASE network demonstrates that Ethereum’s Layer 2 (L2) infrastructure is ready to process institutional and banking transactions in terms of security and scalability.
● Accelerate Regulation: The direct presence of systemic banks will greatly increase the pressure on regulatory bodies such as the SEC to develop transparent and definitive regulatory frameworks for stablecoins.
📊 Impact of Stablecoin Launch on JPMorgan Chase (JPM) Shares
The launch of a proprietary stablecoin could have multi-layered impacts on JPMorgan’s stock value and financial performance:
✅ Positive (bullish) impacts for the stock:
1. New revenue stream:
- Revenue from transaction fees, currency conversion, and related services
- Reduction in international settlement costs (which currently cost billions of dollars)
- Forecast: $500 million to $2 billion in annual revenue if widely adopted
2. Regulatory risk:
- Uncertainty in stablecoin regulations by the SEC and the Federal Reserve
- Possibility of future fines or restrictions
- Need to maintain 100% cash reserves (reducing profitability)
3. Intense competition:
- Competition with USDT (Tether), USDC (Circle), and other bank stablecoins
- “Winner-takes-most” risk in the stablecoin market
4. Reputational and reputational risk:
- Any technical issues, hacks, or loss of dollar support could severely damage JPM’s brand
- Negative impact on stock price in the event of a crisis
📈 Possible stock price scenarios:
Bull Case:
- Rapid adoption by institutional clients
- $2+ billion in revenue by 2028
- Stock price appreciation: 5-25% over 3-5 years
Base Case:
- Gradual and competitive adoption
- $500 million to $1 billion in revenue
- Stock price appreciation: 5-10% (mostly due to avoiding market share loss)
Bear Case:
- Failure to attract users, strict regulations
- High costs without sufficient revenue
- Stock price appreciation: 5-15%
💡 Conclusion:
In the short term (6-12 months), the impact is likely to be neutral to slightly positive, as the market waits to see a successful implementation and early adoption.
In the medium to long term (3-5 years), if JPMorgan can:
- Capture a significant share of the digital payments market
- Control costs
- Align with regulations
This initiative could act as a growth catalyst and significantly increase share value. But failure in this project could be seen as a missed opportunity cost and a sign of a failure to innovate.
Microsoft AI Prediction: Will Ripple (XRP) Reach $4-7 by the End of 2026?

📊 Forecast Details and Expected Growth:
This forecast shows a growth of about 2.6-4.6 times compared to the price of $1.52 at the time of writing the report. Such a price jump requires the alignment of several key fundamental factors, as discussed below.
💡 Fundamental and non-fundamental reasons behind this growth:
● Heavy whale accumulation:
The outflow of 400 million XRP from exchanges and accumulation by large wallets in recent days indicates the confidence of large investors in long-term price targets.
● Explosive growth in network activity (XRPL):
The increase in active network addresses from 47,000 to over 356,000 (a 650% increase) is a testament to the increase in real-time usage and on-network transactions.
● Institutional capital flows into ETFs:
The weekly inflow of $40 million into XRP spot exchange-traded funds (ETFs) and cumulative inflows passing $1.55 billion are a testament to sustained institutional demand.
● Expansion of payment infrastructure:
Ripple’s recent merger with Volante Technologies to facilitate instant payments via the FedNow system paves the way for XRP to be used as a liquidity bridge in the traditional US financial system.
● Regulatory transparency:
The end of legal ambiguities with the SEC and the move towards proprietary rules (such as the CLARITY Act) have greatly reduced the asset’s systematic risk.
⚠️ Risks Ahead:
Achieving these goals requires a credible breakout and consolidation above the key $1.65-$1.70 resistance. Any sudden change in macroeconomic policies or delay in institutional adoption could challenge this bullish trend.
🟠 Bitcoin (BTC/USDT) Technical Analysis on Weekly Timeframe; Rebound from Demand and Battle in Supply
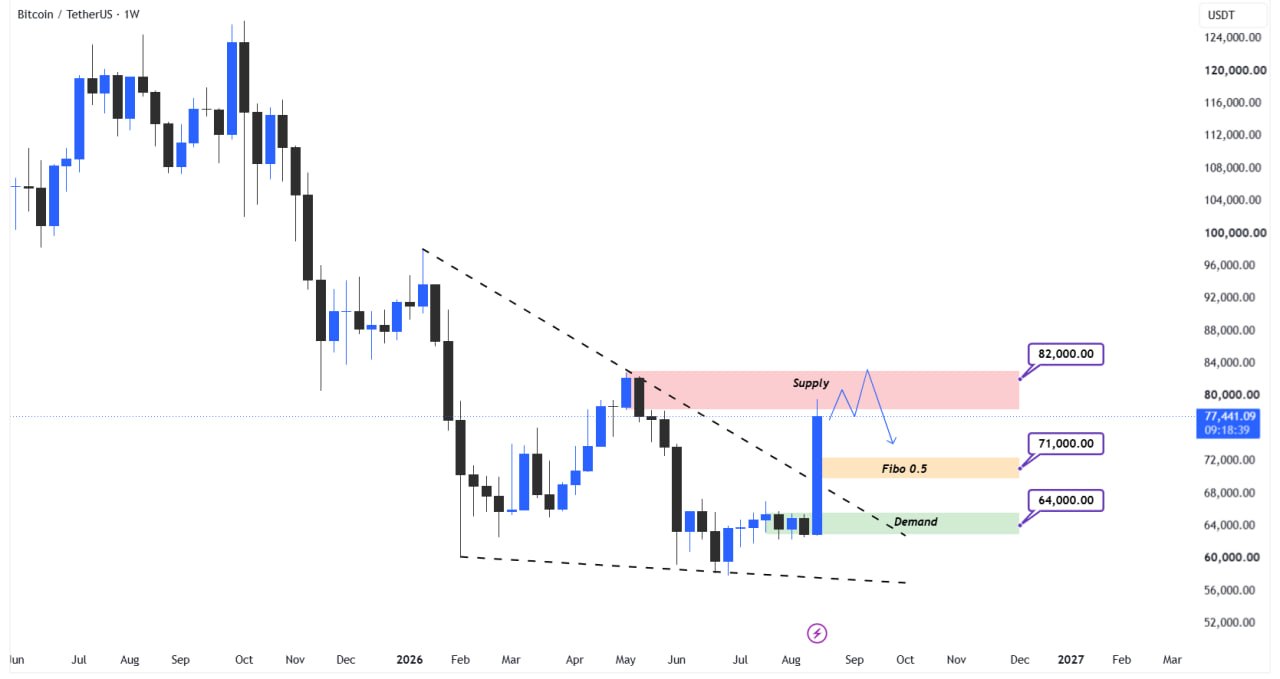
📊 Key areas:
Important resistance (Supply): $82,000
Intermediate support (Fibo 0.5): $71,000
⏺ Key support (Demand): $64,000
⏺ Current price: $77,441
📉 Main scenario (correction and pullback):
With the price entering the Supply area at $82,000, a short-term correction is likely to gather liquidity and retest the supports. In this scenario, a correction to the 0.5 Fibonacci level around $71,000 could be a healthy pullback to continue the upward trend.
⬆️ Bullish scenario:
If Bitcoin can cross the Supply zone at $80,000 and consolidate above it, the path will be paved for a move towards $88,000-92,000 and eventually a return to the previous highs above $100,000.
⬇️ Bearish scenario:
If the $82,000 area is broken and the current levels are not maintained, there is a possibility of a return to $71,000 (Fibo 0.5) and if it is broken, a return to Demand at $64,000.
Supplementary analysis:
● Importance of the Weekly Timeframe: Analysis on this timeframe shows the long-term and medium-term perspective. A break of the downtrend line at this level is a very strong technical signal that is usually taken seriously by institutional traders.
● Role of the Supply Zone at $80,000: This zone, which overlaps with previous resistances, acts as a psychological and technical barrier. Breaking it requires high trading volume and possibly a fundamental catalyst (such as confirmation of the CLARITY Act or government purchase of BTC).
● Pullback to Fibo 0.5: A correction to $71,000 is not only a natural move after the Sharpe rally, but also an opportunity for traders who missed out on the initial move to enter. This level also overlaps with key moving averages.
● Demand at $64,000: As a valid weekly bottom, this area is the last bastion of buyers. Holding this level is crucial for the continuation of the bullish structure, and any valid break below it could signal a trend change.
● Fundamental Alignment: Given recent news about Trump meeting with crypto leaders, the possibility of the US government buying Bitcoin, and $1.92 billion in inflows into ETFs, fundamentals are poised to break $82.000.
🇪🇺 EUR/USD; Bullish scenario remains intact but geopolitical risks remain
However, the re-escalation of Gulf tensions could increase demand for the dollar and put downward pressure on the euro in the short term.
💡 Analysis:
● The 1.150 range is the most important area of interest for buyers.
● Maintaining this range could pave the way for a higher bottom and a range transition to the 1.150-1.160 range.
● Breaking through 1.160 could pave the way for higher targets.
● The targets proposed in the bullish scenario include 1.160 in the coming weeks, 1.170 in the fall, and 1.180 by the end of the year.
● If geopolitical risks intensify and demand for safe-haven assets increases, the strengthening dollar could delay this bullish scenario.
● The absence of a strong stimulus could also cause the range to continue to fluctuate and the range of movements to decrease.
Breaking News; Berkshire Hathaway Becomes a Net Buyer of Stocks Again After 14 Quarters!
📊 Key transaction details:
▫️ Net share purchases: Nearly $19.8 billion ($23.5 billion in purchases vs. $3.7 billion in sales).
▫️ Increased investment in Alphabet (GOOGL): Injecting another $10 billion into Google's parent company.
▫️ Entering the housing sector: Inking a deal to buy shares of Taylor Morrison worth $6.8 billion.
▫️ Cash reserves: Down from $380.2 billion to $364.7 billion.
💡 Analysis:
● The shift from “net seller” to “net buyer” after 14 quarters is a strong psychological and fundamental signal that Berkshire management finds current valuations in certain market sectors (such as technology and housing) attractive.
● However, maintaining a massive cash reserve of $364.7 billion suggests that these purchases are “selective” and “tactical,” rather than an aggressive and broad shift in the overall stock market. This smart approach strikes a balance between hunting for valuable opportunities and maintaining a defensive shield against macroeconomic volatility.
Meta enters the fierce competition in programming tools with the launch of Muse Code
💡 Analysis:
• Meta’s entry into the coding agent market shifts the competition in the generative AI space from the level of general chatbots to specialized and professional software development tools.
• The move could act as a positive catalyst for Meta (META) shares, as it demonstrates the company’s ability to turn its large language models (LLMs) into practical, scalable, and monetizable products.
Remarkable 13% Rally in Amazon (AMZN) Stock Following Better-Than-Expected Earnings Report
The primary driver of this growth was the robust performance of Amazon Web Services (AWS). Revenue for this segment experienced a 37% year-over-year (YoY) growth, reaching approximately $42.2 billion, marking its fastest growth rate in the past 18 quarters.
🧠 Analysis :
These figures indicate that Amazon's substantial investments in Artificial Intelligence (AI) and cloud infrastructure have yielded highly positive results thus far, garnering strong market reception. The rapid expansion of AWS can serve as a powerful catalyst for the continued bullish momentum of AMZN stock, as well as for other companies operating in the cloud computing and AI sectors.
Breaking News: SpaceX Trading Restrictions Lifted; Largest Stock Unlock in History
SpaceX (SPACEX) is on the verge of one of the largest stock unlocks in the history of the capital markets. As the lock-up period (LOCK-UP) nears its end, approximately $16 billion worth of the company's shares, with a valuation exceeding $1.7 trillion, will soon be available for widespread public trading.
📅 Staggered and Unusual Unlock Structure:
Unlike typical companies where insiders must wait 180 days, SpaceX has designed a phased and staggered schedule. Following the release of the quarterly earnings report, insiders are permitted to sell a limited percentage of their shares, and this process continues gradually until day 180 to prevent sudden market shocks. (Note: Elon Musk is exempt from these conditions).
💰 Retail Investor Access and Nasdaq Entry:
Approximately 30% of the shares are allocated for retail investors, and major platforms like ROBINHOOD and FIDELITY have provided direct access. Furthermore, SpaceX will be the first company to utilize Nasdaq's "FAST-ENTRY" rule, potentially joining the NASDAQ 100 index after just 15 days of trading, which will trigger mandatory buying by index funds.
⚠️ Market Warning and Risks:
The sudden unlock of a massive volume of shares could create significant selling pressure in the short term. Experts warn that retail investors must be extremely cautious to avoid falling into the trap of providing "EXIT LIQUIDITY" for early investors and large institutions.
🟢 Technical Analysis of LINK (Chainlink)
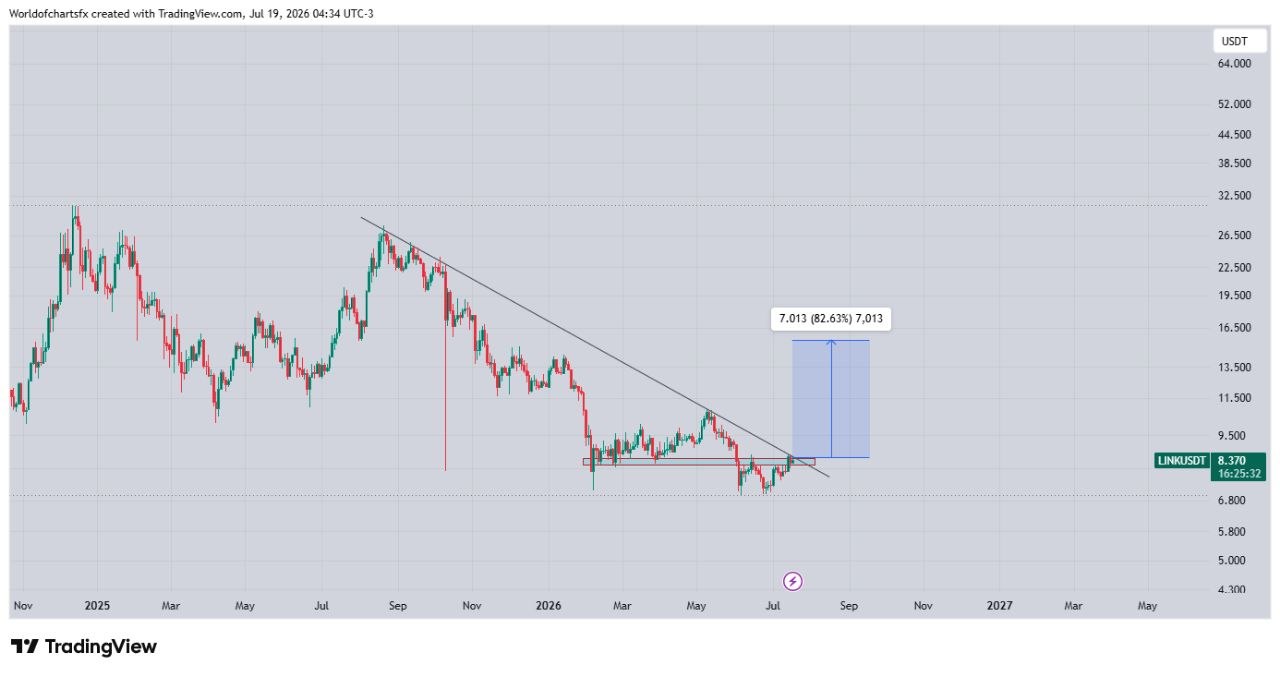
📍 Key Price Levels:
⏺ Major Resistance: $9.00 – $9.50
⏺ Next Resistance: $11.50 – $13.50 (Note: corrected from the original typo "$11.50 - $1.50" for technical coherence)
⏺ Long-Term Target: $16.50 – $19.50
⏺ Key Support: $7.00 – $7.50
⏺ Strong Support: $6.00**
⏺ Current Price: **$8.37
⬆️ Bullish Scenario:
🚀 In the event of a valid breakout above the descending trendline and price stabilization above the $9.0** resistance, a powerful recovery can be anticipated. The initial target lies within the **$11.50 – $13.50** range, with subsequent targets situated at **$16.50 – $19.50.
⬇️ Corrective Scenario:
📉 Should the price fail to breach the resistance levels and retrace back below $7.00**, the likelihood of a neutral continuation or further corrective movement will increase. In this case, the price may decline toward the **$6.00 support level.
💡 Key Highlights:
The recent collaboration between Mantle and Chainlink's CCIP protocol can act as a fundamental catalyst.
The increase in trading volume within the breakout zone confirms the validity of the bullish trend.
The technical structure on higher timeframes indicates significant upside potential.
Artificial intelligence boom sends IBM shares down 25%
📉 Technology company IBM has warned that businesses are diverting their technology budgets to buy servers, memory, chips and networking equipment for artificial intelligence (AI) data centers, and as a result, their spending on software has decreased.
🏢 Budgets shift to hardware:
🏢IBM provides technology equipment and services to companies, banks and governments; powerful enterprise computers (mainframes), enterprise software, cloud services, cybersecurity, artificial intelligence and quantum computing.
⚠️ IBM Systems said in the final weeks of June that it was prioritizing many infrastructure equipment purchases to get the hardware it needs before prices and costs increase. The shift has put several large IBM contracts on hold.
📊 Financial Forecast and Market Reaction:
📊 The company raised its second-quarter revenue forecast by just 1% to $17.2 billion, below analysts’ expectations of $17.86 billion. The per-share forecast was also lower than market expectations.
📉 Following the warning, IBM shares fell about 25%, a drop that could wipe about $70 billion off the company’s market value if sustained. Shares of other software companies, including Microsoft, Salesforce, and ServiceNow, also fell between 2% and 5%.
💻 Fundamental Weakness in Software:
💻 A significant part of IBM’s weakness is in its mainframe business. The super-powerful computers that banks, policymakers, and governments use to process massive amounts of transactions.
🛡️ In addition to the AI push, companies are also spending more on cybersecurity. Because advanced AI models are getting better at software discovery, this is causing the tech industry to focus more budgets on hardware and security, with other software being given a lower priority.
🤖 Meta AI's Forecast: Gold and Silver to Break Records by the End of 2026
🎯 Predicted Price Targets
🥇 Gold:
🔹 Minimum Target: $4,800
🔹 Maximum Target: $5,200
🔹 Potential Growth: Up to 30% from current levels
🔹 Timeframe: End of 2026
🥈 Silver:
🔹 Minimum Target: $78
🔹 Maximum Target: $90
🔹 Potential Growth: Up to 40% from current levels
🔹 Timeframe: End of 2026
🚀 Main Drivers of the Bull Run
🌐 Macroeconomic Conditions:
🔹 Decline in real interest rates
🔹 Persistent government budget deficits
🔹 Elimination of the opportunity cost of holding precious metals
🔹 Expansionary monetary policies by central banks
💵 De-dollarization and Structural Buying:
🔹 De-dollarization trends in emerging markets
🔹 Massive purchases by central banks
🔹 Creation of powerful structural demand for gold
🔹 Independence from any single nation's policy decisions
⚖️ Differences in Drivers for Gold and Silver
🏭 Silver; A Dual-Driver Metal:
🔹 Monetary characteristics similar to gold
🔹 Extensive industrial demand
🔹 Widespread use in solar panels
🔹 Applications in electric vehicles and electronics
⛏️ Silver Supply Shortage:
🔹 Physical demand growing faster than extraction
🔹 Declining ore grades
🔹 Lack of investment in new mines
🔹 Creation of a long-term scarcity premium
🐻 Bearish Scenario and Support Levels
⚠️ Upcoming Risks:
🔹 A dramatic hawkish pivot by the Federal Reserve
🔹 Inflation cooling faster than expected
🔹 Potential interest rate hikes to 6% or higher
🔹 Disruption of the bullish trend
📉 Bearish Scenario Targets:
🔹 Gold: Correction down to $3,600
🔹 Silver: Correction down to $48
🔹 Potential Drop for Gold: Approximately 25%
🔹 Potential Drop for Silver: Approximately 35%
🛡️ Buyer Behavior During Price Dips
🧲 Supporting Factors:
🔹 Debt ceiling tensions in 2026
🔹 Election-related uncertainties
🔹 Aggressive activation of buyers during price dips
🔹 Preservation of the long-term bullish trend
📝 Conclusion
📊 Meta AI's analysis indicates that precious metals have the potential to break records in 2026, with gold potentially reaching the $4,800 to $5,200 range and silver hitting $78 to $90. The main catalyst for this movement is a combination of falling real interest rates, government budget deficits, and structural central bank buying amid de-dollarization trends.
⚡ Due to its dual demand (monetary and industrial) and supply shortages caused by declining mine grades, silver holds greater growth potential than gold, though it will also experience sharper declines in a bearish scenario.
🛡️ Nevertheless, analysts believe that due to debt ceiling tensions and political uncertainties, buyers will aggressively step in during any price dips, which could prevent deep corrections.
JPMorgan Revises Gold Forecast from $6,000 to $4,500
●●● History of Gold Forecasts and the Role of Wall Street Banks
Gold has been known for thousands of years as a store of value and a safe haven against inflation and crises.
In the 1970s, the price of gold rose from $35 to $850, and Wall Street banks published their official forecasts for the first time.
In 2011, gold reached $1,920, and banks like Goldman Sachs and JPMorgan provided $2,000 forecasts.
In 2020, with the coronavirus pandemic, gold reached $2,075, and banks provided more ambitious forecasts.
In 2024, with the growth of central bank demand (1,000 tons per year) and geopolitical tensions, gold reached $2,800.
In 2025, JPMorgan predicted that gold would reach $6,000, but in 2026, it revised this forecast.
●●● JPMorgan's Forecast Revision
In its latest report, JPMorgan has lowered its long-term forecast for gold.
🔹 New Forecasts:
▫️ Q3 2026: $4,300
▫️ Q4 2026: $4,500 (instead of $6,000)
▫️ Reduction amount: 25% from the previous forecast
▫️ Status: Downward revision
🔹 Reasons for Revision:
▫️ Retreat of major buyers (central banks)
▫️ Increased market sensitivity to real interest rates
▫️ Gold stagnating within a specific range
▫️ Decreased bullish momentum
●●● Comparison with Other Wall Street Banks
Not all Wall Street giants agree with JPMorgan, and they have different views on the future of gold.
🔹 End of 2026 Forecasts:
▫️ JPMorgan: $4,500 🔻
▫️ Goldman Sachs: $4,900
▫️ UBS: $5,200
▫️ Morgan Stanley: $5,200
▫️ Difference: $700 between the lowest and highest
🔹 Interpretation of Differences:
▫️ JPMorgan: The most cautious forecast
▫️ Goldman Sachs: Medium-term and balanced
▫️ UBS and Morgan Stanley: The most optimistic
▫️ Indicates uncertainty in the market
●●● Analysis of Reasons for JPMorgan's Revision
🔹 Retreat of Major Buyers:
▫️ Central banks: Slowing pace of purchases (from 1,000 tons per year)
▫️ Gold ETFs: Capital outflows in recent months
▫️ Institutional investors: Reduction of long positions
▫️ Impact: Decreased structural demand
🔹 Sensitivity to Real Interest Rates:
▫️ Real interest rates: Rising due to Federal Reserve policy
▫️ Impact on gold: The cost of holding gold has increased
▫️ Alternatives: Bonds and the dollar have become more attractive
▫️ Result: Pressure on gold prices
🔹 Stagnation in a Specific Range:
▫️ Current range: $4,000-$4,100
▫️ Inability to break resistance levels
▫️ Decreased volatility
▫️ Need for a new catalyst to move
●●● Future Gold Scenarios
🔹 JPMorgan Scenario (35% probability):
▫️ Continued stagnation in the $4,000-$4,500 range
▫️ Further retreat of major buyers
▫️ Consolidation of high interest rates
▫️ Target: $4,500 in Q4 2026
🔹 Goldman Sachs Scenario (40% probability):
▫️ Gradual growth towards $4,900
▫️ Return of major buyers
▫️ Gradual decrease in interest rates
▫️ Target: $4,900 by the end of 2026
🔹 UBS and Morgan Stanley Scenario (25% probability):
▫️ Strong growth towards $5,200
▫️ New geopolitical crisis
▫️ Rapid interest rate cuts
▫️ Target: $5,200 by the end of 2026
●●● Implications for Investors
🔹 For Gold Holders:
▫️ Patience and avoiding emotional selling
▫️ Reviewing the investment portfolio
▫️ Diversifying into other assets
▫️ Long-term perspective
🔹 For Traders:
▫️ Trading within the $4,000-$4,100 range
▫️ Using swing trading strategies
▫️ Observing risk management
▫️ Paying attention to economic data
🔹 For New Investors:
▫️ Dollar-cost averaging at lower prices
▫️ Using gold funds
▫️ Not investing all capital
▫️ Thorough research before entry
●●● Conclusion
In its latest report, JPMorgan reduced its gold price forecast for Q4 2026 from $6,000 to $4,500, indicating a 25% revision and a retreat from previous ambitions.
The main reason for this revision is the retreat of major buyers (central banks and ETFs) and increased market sensitivity to real interest rates, which has caused gold to stagnate in the $4,000-$4,100 range for now.
However, not all Wall Street banks agree with JPMorgan; Goldman Sachs has a $4,900 forecast, and UBS and Morgan Stanley have a $5,200 forecast for the end of 2026, with a $700 difference indicating uncertainty in the market.
For investors, this situation indicates the need for patience, diversification, and strict risk management; as the gold market is in a transitional phase, and its next move depends on Federal Reserve decisions, central bank behavior, and geopolitical developments.
Ultimately, gold remains a safe haven and a hedge against inflation, but its explosive growth requires new catalysts that are not currently visible in the near-term outlook.
Comprehensive Silver Analysis; From 50% Crash to $130 Targets
●●● Current Status; 50% Crash from the Peak
Silver prices reached their all-time high of over $121 per ounce in January 2026.
🔹 Crash Specifications:
▫️ All-time high: $121 (January 2026)
▫️ Current bottom: Around $60
▫️ Crash magnitude: Over 50%
▫️ Correction duration: Several months
🔹 Reasons for the Crash:
▫️ Natural correction following rapid growth
▫️ Market euphoria at the beginning of the year
▫️ Need to build a new bottom
▫️ Profit-taking by investors
🔹 Bottom Range Forecast:
▫️ Pavel Mladjenovic: $58 to $62
▫️ Current status: Within this exact range
▫️ Interpretation: Strong buying opportunity
●●● Bullish Forecasts; Surge to $130
Despite the crash, the long-term price outlook for silver remains bullish, and numerous analysts believe silver can return to the three-digit channel once again.
🔹 First Reason; Chronic Supply Deficit:
▫️ The Silver Institute: 2026 marks the sixth consecutive year of supply deficit
▫️ Mine production: Unable to meet demand
▫️ HSBC forecast: Deficit reduction in the coming years
▫️ Impact: Price support
🔹 Second Reason; Strong Industrial Demand:
▫️ Solar energy: Extensive use in solar panels
▫️ Semiconductors: Use in chips and electronics
▫️ Electric vehicles: Need for silver in batteries
▫️ Risk: Substitution or reduced consumption at high prices
🔹 Third Reason; Analyst Forecasts:
▫️ Pavel Mladjenovic: $80 by the end of 2026, $110-$130 in 2027
▫️ Keith Neumeyer (First Majestic): $100 has been achieved, this is just the beginning
▫️ Other analysts: $100-$130 targets
▫️ Consensus: New bull market
●●● Cautious Views and Warnings
Alongside bullish forecasts, warning voices are also being heard from some analysts.
🔹 HSBC Warning:
▫️ Raised price forecast but with caution
▫️ Limited room for growth
▫️ Future reduction in supply deficit
▫️ Softening demand
🔹 HSBC Forecast:
▫️ 2026: Average of $75
▫️ 2027: Average of $68
▫️ Interpretation: Limited growth and gradual correction
▫️ Reason: Supply and demand balance
🔹 Fundamental Risks:
▫️ Reduction in supply deficit
▫️ Substitution of silver in industries
▫️ Rising interest rates
▫️ Global economic recession
●●● Silver vs. Gold Comparison
🔹 Gold-to-Silver Ratio:
▫️ Historical average: 60 to 1
▫️ Current ratio: Around 50 to 1
▫️ Interpretation: Silver is cheap relative to gold
▫️ Potential: Catching up
🔹 Advantages of Silver over Gold:
▫️ Broader industrial application
▫️ Smaller market and higher volatility
▫️ Higher growth potential
▫️ Dependence on industrial cycles
🔹 Disadvantages of Silver compared to Gold:
▫️ More severe fluctuations
▫️ Dependence on economic conditions
▫️ Higher storage costs (greater volume)
▫️ Risk of industrial substitution
●●● Price Scenarios
🔹 Optimistic Scenario (35% probability):
▫️ Continuation of supply deficit
▫️ Growth in industrial demand
▫️ Return to $100-$120
▫️ Timeframe: 12-18 months
🔹 Base Scenario (45% probability):
▫️ Fluctuation in the $60-$80 range
▫️ Relative balance of supply and demand
▫️ Gradual growth
▫️ Timeframe: 6-12 months
🔹 Pessimistic Scenario (20% probability):
▫️ Reduction in supply deficit
▫️ Economic recession
▫️ Drop to $50-$55
▫️ Timeframe: 3-6 months
●●● Investment Strategies
🔹 For Long-Term Investors:
▫️ Dollar-cost averaging in the $58-$62 range
▫️ 2-3 year horizon
▫️ Diversifying the precious metals portfolio
▫️ Patience through short-term volatility
🔹 For Short-Term Traders:
▫️ Swing trading in the $58-$75 range
▫️ Using stop-losses
▫️ Monitoring industrial news
▫️ Strict risk management
🔹 For Beginners:
▫️ Starting with small amounts
▫️ Education before entry
▫️ Using silver ETFs
▫️ Avoiding high leverage
●●● Conclusion
Silver reached its all-time high of $121 in January 2026 and then fell to the $60 range with a drop of over 50%, a correction that is largely viewed as a natural pullback following rapid growth and market euphoria.
Numerous analysts, including Pavel Mladjenovic and Keith Neumeyer, believe that silver is building a bottom in the $58-$62 range and has the potential to return to the three-digit channel ($100-$130), especially given the chronic supply deficit (sixth consecutive year) and strong industrial demand from the solar energy, semiconductor, and electric vehicle sectors.
However, cautious views also exist; HSBC, while raising its price forecast, has warned about limited room for growth and predicts that silver will average $75 in 2026 and around $68 in 2027, as a reduction in the supply deficit and softening demand could hinder sustainable growth.
For investors, the current $58-$62 range could present an attractive buying opportunity, but risks such as a declining supply deficit, silver substitution in industries, and macroeconomic conditions must be considered, and investment strategies should be adjusted based on time horizon and risk tolerance.
Ultimately, silver is at a historic turning point, and deciding whether it is an "opportunity" or a "trap" depends on the market's ability to maintain the supply deficit and industrial demand in the coming years.