
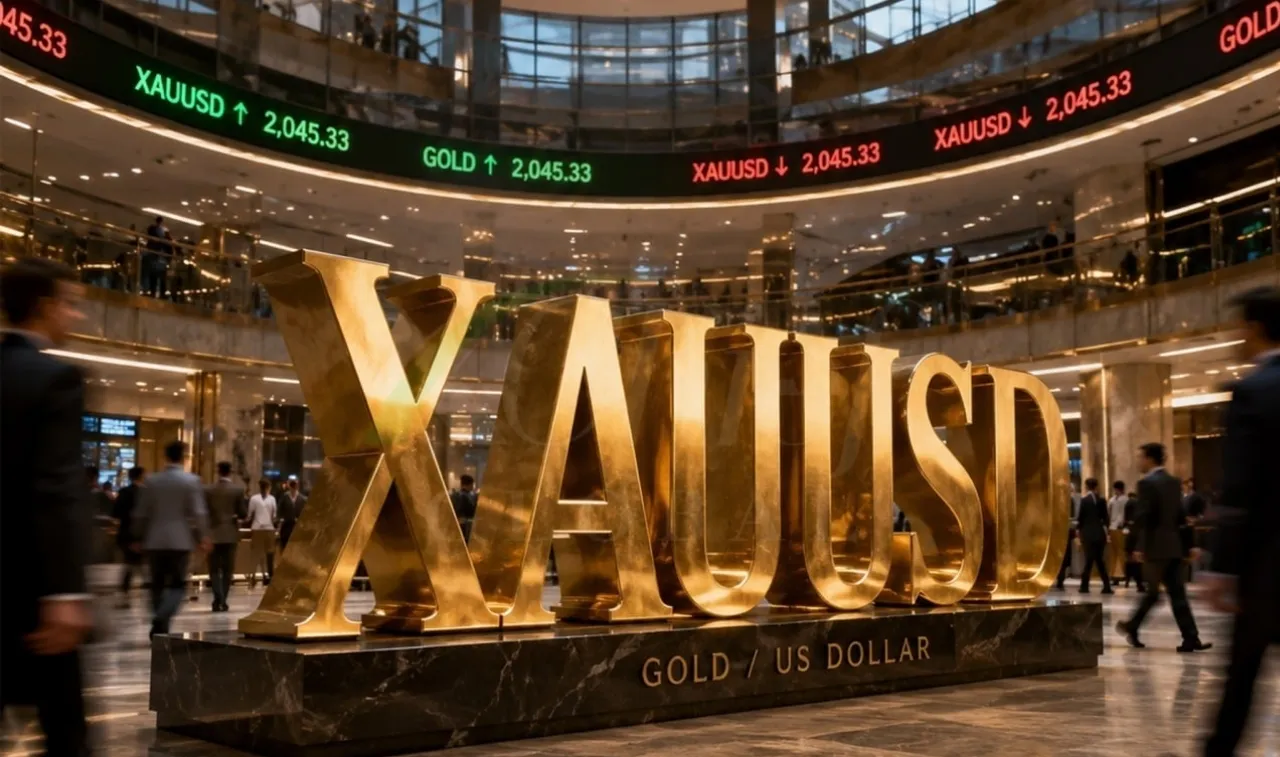

Analysis of Gold Bar Price in Global Markets
The inflation rate and fluctuations in the statistics of the macroeconomy of the world's industrial countries, as well as the status of the stock and bond markets, and also the US Dollar Index DXY in global markets, can play an effective role in determining the price in gold markets, and rising interest rates in the 🇺🇸 United States can also act as a factor for a reverse trend in the global gold ounce price.
Among the important and effective fundamental factors, one can mention the massive gold purchases by the central banks of countries as a reserve for the national currency and smart money.
 Online Technical Analysis Chart of Gold Price in Global Markets with the Symbol GOLD at CAPITALCOM Broker
Price in United States Dollars





🔴 Coins whose trust index is in the red category are not suitable for long or short-term holding...
🟠 Coins in the orange and yellow categories require caution...
🟢 Coins in the green category can be held for a period of time...
Online Technical Analysis |
🏛️ Select Exchange: --- | ---
 By viewing charts on a computer or enabling the DESKTOP SITE option, you will get a more comprehensive view.
Signal Buy and sell using Bollinger Bands 20
The Bollinger chart (from the Volatility Indicators category) is an analytical tool used to evaluate the market situation.

What is Technical Analysis?
In this analysis, using charts and related information including price, volume, and various techniques and tools, the overall situation of the market is examined.


ONCHAIN Charts
On-chain data is very important information that can be used to review the situation of the digital currency market.

📰 NEWS
Specialized news and analysis are prepared from credible sources, avoiding controversial, baseless content, rumors, or unverified topics:
🤖 Meta AI's Forecast: Gold and Silver to Break Records by the End of 2026
JPMorgan Revises Gold Forecast from $6,000 to $4,500
There are always other effective factors on crypto market prices. Decide to buy or sell calmly and avoid any haste. Before buying or selling any token, check the Bitcoin analysis once. The most important issue is investment security.
If charts are not visible, please update your browser or use the latest version of Google Chrome.