
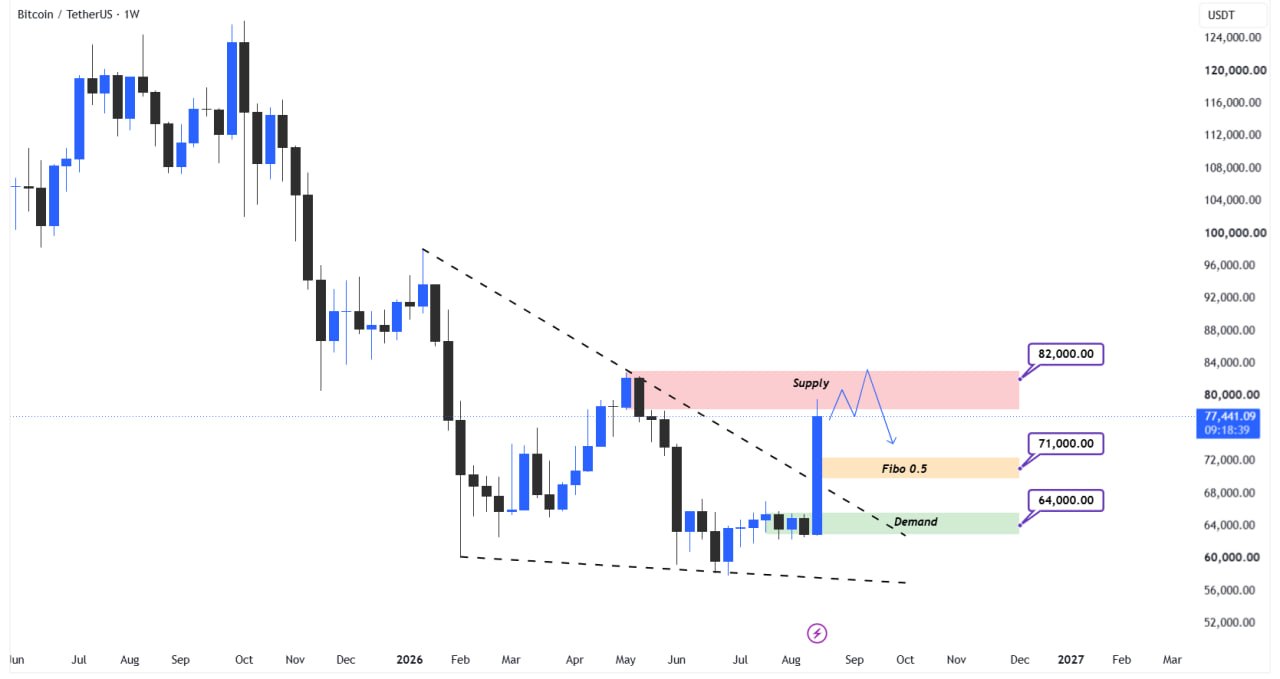
Bitcoin (BTC) has reacted strongly from the weekly Demand area at $64.00 after a long correction period, breaking the downtrend line with a sharp move. This move shows that the short-term momentum has returned to the buyers, but the price has now entered a significant resistance area, at the threshold of $77,441.
📊 Key areas:
Important resistance (Supply): $82,000
Intermediate support (Fibo 0.5): $71,000
⏺ Key support (Demand): $64,000
⏺ Current price: $77,441
📉 Main scenario (correction and pullback):
With the price entering the Supply area at $82,000, a short-term correction is likely to gather liquidity and retest the supports. In this scenario, a correction to the 0.5 Fibonacci level around $71,000 could be a healthy pullback to continue the upward trend.
⬆️ Bullish scenario:
If Bitcoin can cross the Supply zone at $80,000 and consolidate above it, the path will be paved for a move towards $88,000-92,000 and eventually a return to the previous highs above $100,000.
⬇️ Bearish scenario:
If the $82,000 area is broken and the current levels are not maintained, there is a possibility of a return to $71,000 (Fibo 0.5) and if it is broken, a return to Demand at $64,000.
Supplementary analysis:
● Importance of the Weekly Timeframe: Analysis on this timeframe shows the long-term and medium-term perspective. A break of the downtrend line at this level is a very strong technical signal that is usually taken seriously by institutional traders.
● Role of the Supply Zone at $80,000: This zone, which overlaps with previous resistances, acts as a psychological and technical barrier. Breaking it requires high trading volume and possibly a fundamental catalyst (such as confirmation of the CLARITY Act or government purchase of BTC).
● Pullback to Fibo 0.5: A correction to $71,000 is not only a natural move after the Sharpe rally, but also an opportunity for traders who missed out on the initial move to enter. This level also overlaps with key moving averages.
● Demand at $64,000: As a valid weekly bottom, this area is the last bastion of buyers. Holding this level is crucial for the continuation of the bullish structure, and any valid break below it could signal a trend change.
● Fundamental Alignment: Given recent news about Trump meeting with crypto leaders, the possibility of the US government buying Bitcoin, and $1.92 billion in inflows into ETFs, fundamentals are poised to break $82.000.